

MuscleTiger research notes · No. 4
Calculate your real TDEE: estimating real energy expenditure from weight and food logs
A calorie calculator turns your height, weight, age and activity into a daily target in a second. For many people the number is close; for others it is off by several hundred calories a day, and the formula has no way of telling you which group you are in. Your food log and your weight over a few weeks can: together they show what your body actually did with the food.
TL;DR
Over a few weeks, the calories you eat minus the energy stored or lost as body weight equals the calories you burn. An app can use this to correct a formula with your own data. In our simulation the corrected estimate beats the formula after about six weeks (typical error 110–120 kcal/day against 160–170). In weeks 2 to 4 of a new diet it can be worse, because early water loss is mistaken for fat loss; the app now estimates water and glycogen separately, which removes most of that problem when the water shift follows the plan, though not in the harshest case. Its best property is consistency, while its accuracy is modest: if you under-log your food by a steady share, the corrected target compensates and the real deficit stays close to the plan.
This note is about the step after the formula. The forecast note showed that the scale is noisy and that a standard estimate of daily energy use is typically off by about 5% or more. Here we ask what can be done about that with data a person already collects, weight and food. We explain the principle and the equations, describe how the adaptive calorie goal in MuscleTiger works, and test it in a simulation, including where it fails: we found one weakness in the current version while writing this. The numbers come from published studies, listed at the bottom; where we calculate or simulate something ourselves, we say so.
1. A formula is a good start and an uncertain finish
The most widely used starting point is the Mifflin–St Jeor equation. It was fitted to 498 healthy adults aged 19 to 78 whose resting energy expenditure was measured by indirect calorimetry [1]:
where is weight in kilograms, height in centimetres and age in years; the result is kcal per day at rest. A systematic review of the four equations most used in practice (Harris–Benedict, Mifflin–St Jeor, Owen and the WHO/FAO/UNU equations) judged Mifflin–St Jeor the most reliable: it came within 10% of the measured value in more people than any other equation and had the narrowest error range [2]. The same review is just as clear about the limit: it lists “noteworthy errors” when the equations are applied to individuals and recommends measuring resting metabolism with indirect calorimetry when an error matters. For someone who really burns 1,700 kcal/day at rest, “within 10%” means anything from 1,530 to 1,870.
Resting energy is only part of the total. To get daily expenditure you multiply it by an activity factor that someone has to pick, and one “lightly active” covers very different weeks. Hall and colleagues [3] say that even a good estimate of expenditure is typically off by about 5% of the true value, and sometimes more. For a person who burns 2,600 kcal/day that is 130 kcal, or 260 kcal at 10%. It looks small next to a meal, but it adds up: in the first note we calculated that an error of 100 kcal/day moves the weight you eventually settle at by about 4.5 kg (10 lb).
2. The idea: let the body do the measurement
Energy is conserved. Over a stretch of time, the energy you eat either goes into body stores or is burned. If body weight changes by over days, the stores changed by about kcal, so
where is average daily expenditure, is average daily intake and is the energy value of a kilogram of weight change. Researchers use the same bookkeeping, in the other direction, as their reference method: they measure expenditure with doubly labelled water and add the change in body energy stores to get what people actually ate [9]. Mathematical modelling of weight is also named as a newer way to estimate real intake in obesity research, because self-reports are unreliable [7].
The weight-only version has been tested. Sanghvi and colleagues [11] took 140 people who ate less for two years and compared the change in intake from the doubly labelled water method with that from a model whose only inputs were demographics and repeated weights. On average the model was within 40 kcal/day of the reference, so the principle holds for groups over months. For individuals it is much weaker: the root-mean-square difference was 215 kcal/day, most values were within 132 kcal/day, but the limits of agreement spanned about 800 to 1,000 kcal/day, and the authors themselves advise caution with any single value. Their comparison used six-month intervals and monthly weights, so it says little about the first weeks, which is where the next section starts.
3. Four things that make it hard
Equation (2) has three inputs, each with its own kind of error, and expenditure itself is not constant. Together that makes four problems.
The weight trend is noisy, and a small error in it becomes a large error in calories
A kilogram per week corresponds to about 1,100 kcal/day (our arithmetic: 7,700 kcal/kg divided by 7 days). An error of only ±0.1 kg/week in the trend therefore means about ±110 kcal/day in the estimate. The first note showed how much the scale moves for reasons that have nothing to do with fat, which is why a single pair of readings is useless here. The app instead uses a filter that estimates the trend and its slope together (see section 4).
The conversion factor is also not exact. A kilogram of lost tissue holds between roughly 1,800 kcal (lean tissue) and 9,400 kcal (fat) [3], and the dynamic model of Chow and Hall uses an effective 9,100 kcal/kg [4]. We use the conventional 7,700 in the estimator and, in the simulation below, let the simulated person follow the 9,100 model. At a loss of 0.5 kg/week the two factors differ by about 100 kcal/day, so this alone pushes the estimate 80 to 100 kcal/day too low in someone who is losing weight. We left that mismatch in the simulation so that the results include the error we actually have.
The early water drop looks like fat loss
In the first one to two weeks of a diet, a kilogram or two of glycogen and the water bound to it can leave the body without any fat loss [10]. Controlled studies put numbers on it. In 19 adults with obesity living in a metabolic ward, a 30% calorie cut for six days took off 1.3 kg when the carbohydrate intake was kept and 1.85 kg when it was cut, while the measured fat loss was only 0.46 and 0.25 kg [13]. Switching men to a ketogenic diet with the same calories took off another 1.6 kg within 15 days with almost no fat loss [14]. On 800 kcal a day for ten days, water made up 37% of the weight lost on a mixed diet and 61% on a ketogenic one [15]. Most of that weight is water and glycogen, which carry almost no energy, but equation (2) cannot know that. If 1.5 kg disappears over ten days, the raw estimate sees a loss of 0.15 kg per day and reads it as about 1,150 kcal/day of extra expenditure (our arithmetic: 0.15 × 7,700). Smoothing dilutes the effect without removing it. The authors of the weight-only method describe the same thing: in three inpatients on 800 kcal a day the rapid initial loss made the method overestimate the intake change, because it does not account for body water, and it became accurate only after that phase [12]. This is the main reason the estimate is poor early in a diet, and we measure it below.
UPDATE
The adaptive calorie goal now estimates water and glycogen separately. It treats the scale reading as tissue plus water. The water estimate starts from your plan: the calorie deficit, the carbohydrates in your macros and your training level. A person who is not dieting and has no change in carbohydrates starts with almost no expected shift, which fits an experienced athlete at maintenance. Your weigh-ins then correct the estimate: the slow trend is a change in tissue, and how far the scale sits from that trend is water, glycogen and food in the stomach. The energy equation now uses only the tissue trend. The estimate is used only inside the calorie calculation. We do not draw it as a chart for you, because the scale alone cannot measure water reliably.
The size of the effect follows the controlled studies cited above [13]–[15]. How much it helps in a simulation is in section 5.
Food logs are biased, and the bias is the largest unknown
People record less than they eat. In a classic study, obese patients who said they could not lose weight on under 1,200 kcal/day were measured for two weeks: their energy expenditure was within 5% of what is predicted for their body composition, but they had under-reported their food by 47 ± 16% and over-reported their physical activity by 51 ± 75% [6]. That was ten people, a small and selected group, but the direction has held up: a review notes that in people with obesity, self-reported adherence to a calorie prescription typically underestimates intake by 30% to 50% compared with doubly labelled water [7]. A later analysis of 221 adults in a UK survey found reported intake well below measured expenditure, with more under-reporting in people with an obese BMI, in the more active and in the younger; once the data were scaled for body mass, obesity itself no longer predicted more under-reporting in weight-stable adults [8]. So how large the bias is, and who has most of it, is still argued about. That it exists is not.
Expenditure itself drifts
The fourth problem is not caused by equation (2), but it has to be lived with: energy expenditure falls during weight loss by more than the smaller body explains. In people who kept their weight at least 10% below their usual weight, total expenditure was lower by 6 ± 3 kcal per kilogram of fat-free mass per day in those who had never been obese, and by 8 ± 5 in those who had [5]. During a diet, an estimate from the last few weeks therefore describes what you burn now, which can differ from what you burned at the start.
4. What the app does, step by step
The adaptive calorie goal in MuscleTiger runs the following loop. We describe the logic and leave out the tuning values.
- Start from the formula. Mifflin–St Jeor times an activity factor, adjusted down slightly for people who are losing weight, because formulas are known to overestimate during a diet. The size of that adjustment is our own choice; no controlled study supplies it.
- Filter the weight. A Kalman filter estimates your tissue weight, its rate of change and the accumulated water together from the noisy readings. Its starting guess for the rate comes from your plan, and your data take over as they accumulate. The starting guess for water comes from the plan too (see the update in section 3). Readings that are far from the trend are discarded as outliers, and readings after poor sleep or high stress count for less, because those days tend to hold more water. That last rule is a design choice that we have not measured.
- Average the intake. Each day we take the mean of the recent week of logged intake, using only days whose log looks complete. If too many days are missing, the estimate is left where it was.
- Apply equation (2) each day. The raw estimate is the recent average intake minus the energy value of the filtered rate of weight change.
- Smooth it. The expenditure estimate moves only part of the way towards today's raw value:
where is the recent mean of logged intake, is the filtered rate of change in kg/day and is a small fraction. A small makes the estimate forget old information slowly, so it averages over the last week or two instead of following every day.
- Turn it into a target. The recommended calories are the estimate, plus your average exercise energy, minus the deficit (or plus the surplus) that your goal asks for. The result is kept within a margin around the formula-based goal and never goes below a safety floor. If you train and your weight is essentially flat, the feature holds your calories instead of cutting them; that is a choice for people recomposing and has no evidence-based threshold behind it. The goal is recalculated every few days from the most recent month, and only when there are enough weigh-ins in that window.
5. Does it work? A simulation
We have no laboratory measurement of expenditure for our users, so we cannot say how accurate the feature is in real life. What we can do is simulate people for whom we know the truth and run the same logic on them. The simulation is ours: it shows what the method can do under stated assumptions and says nothing about what it did for any real person.
The simulated person. A 90 kg (198 lb) adult who really burns 2,600 kcal/day and follows the dynamic model of Chow and Hall [4] (9,100 kcal/kg, expenditure rising 22 kcal per kg of body weight). They aim for a 500 kcal/day deficit. The formula's guess of their expenditure is off by a random amount with a standard deviation of 10%. Their daily intake varies by 15% around the plan; they log with a random error of 10% per day and skip a log on 15% of days; they weigh on four days out of five. The scale reading is the true weight plus a weekly rhythm of 0.3 kg, random noise of 0.6 kg and, over the first ten days or so, a 1.5 kg drop of water and glycogen that carries no energy. We ran 1,500 simulated people per setting.
Accuracy of the expenditure estimate
The table compares the median absolute error of the formula with that of the estimate from logs and weight, for 1,500 simulated people who keep eating at the original plan and log without a systematic bias.
| Week | 1 | 2 | 3 | 4 | 6 | 8 |
|---|---|---|---|---|---|---|
| Formula only, median error (kcal/day) | 182 | 179 | 175 | 172 | 168 | 161 |
| Logs and weight, median error (kcal/day) | 182 | 233 | 311 | 289 | 110 | 120 |
| The same without the water drop | 171 | 162 | 138 | 117 | 121 | 110 |
| Within ±100 kcal: formula | 28% | 29% | 29% | 30% | 31% | 31% |
| Within ±100 kcal: logs and weight | 28% | 22% | 15% | 13% | 47% | 42% |
Three things stand out. In week 1 the two are identical, because the app changes nothing until it has enough data. In weeks 2 to 4 the corrected estimate is worse than the formula: the early water loss pushes it up, and the third row shows that without the water drop it would already be better by week 3. From week 6 it wins: a typical error of 110 to 120 kcal/day against 160 to 170, and the share of people within 100 kcal of the truth rises from about 30% to over 40%.
After the update: modelling water
The table above describes the version without a water estimate. We ran a new set of simulated people through both versions, in five situations. In the first, everyone loses the 1.5 kg of water assumed above, regardless of the plan, which is the harshest case. In the next two, the water that is lost follows the plan: it grows with the calorie deficit and with the cut in carbohydrates, as in the studies, so a typical plan loses about a kilogram within a week or two. The last two are a person with no deficit, such as an experienced athlete at maintenance, and a person whose water does not change at all. The numbers are the median error of the expenditure estimate, kcal/day.
| Situation | Version | Week 1 | 2 | 3 | 4 | 6 | 8 |
|---|---|---|---|---|---|---|---|
| Formula only (all situations, within a few kcal) | – | 174 | 169 | 167 | 166 | 162 | 160 |
| 1.5 kg of water for everyone | before | 175 | 223 | 299 | 273 | 107 | 118 |
| after | 175 | 192 | 215 | 203 | 106 | 116 | |
| Typical plan, water follows deficit and carbohydrates | before | 175 | 152 | 145 | 119 | 113 | 109 |
| after | 175 | 147 | 128 | 112 | 112 | 109 | |
| Plan with a large carbohydrate cut | before | 175 | 176 | 182 | 145 | 113 | 108 |
| after | 175 | 158 | 139 | 117 | 112 | 108 | |
| No deficit (maintenance) | before | 174 | 158 | 143 | 124 | 113 | 115 |
| after | 174 | 158 | 143 | 123 | 112 | 114 | |
| Dieting, but no water change at all | before | 175 | 166 | 141 | 122 | 115 | 119 |
| after | 175 | 189 | 173 | 145 | 115 | 116 |
Wherever a water shift exists and it follows the plan, the version with a water estimate is better in weeks 2 to 4 and no worse later, and in the typical case it is better than the formula from week 2. For someone with no deficit it changes nothing, which is what we want. In the harshest case it helps a lot (299 down to 215 in week 3), but it stays above the formula in weeks 2 to 4, so the first month is still provisional. The cost sits in the last row: when a person is dieting and their water does not move, the estimate expects a shift that does not come and loses about 20 to 30 kcal/day in weeks 2 and 3. The size of the water effect in the model comes from the three controlled studies above and is fitted by us to their numbers, so it is a calibration and was never measured on MuscleTiger users.
How this compares with other ways to know your expenditure
The numbers below come from different studies that measure different things, so they are not a like-for-like ranking. They show the order of magnitude each method works in.
| Method | What the source reports | Source |
|---|---|---|
| Equation only (Mifflin–St Jeor) | Within 10% of measured resting energy in more people than the other common equations; typical expenditure estimate off by about 5% | [2], [3] |
| Food log alone | Intake under-reported by 30–50% in people with obesity (47 ± 16% in a diet-resistant group) | [7], [6] |
| Weight-based model against doubly labelled water | Change in intake: mean within 40 kcal/day; individual RMS difference 215 kcal/day | [11] |
| Doubly labelled water itself | About ±5% method error; repeated tests on one person typically vary by about ±150 kcal/day; estimates built on fewer measurements agree with the full set within 121–275 kcal/day (95% limits) | [9] |
| Our simulation: logs and weight, weeks 6–8 | Median error 110–120 kcal/day, against 160–170 for the formula | this note |
Read together, a typical error of 100 to 200 kcal/day is about where every practical method ends up, including the laboratory one. That is why we present the corrected number as an estimate with a margin. Our simulated figure is also the friendliest of the five: a steady person who weighs often and logs regularly, which real life rarely is.
What a consistent logging bias does
The most useful property of the method is how it handles a bias you cannot see; its accuracy matters less. Suppose that every day you log a share less than you really eat, and you do not know it. We simulate people who follow the target they are given, so the target affects what they eat, and compare two setups with the same plan: a target fixed by the formula, and a target corrected by logs and weight.
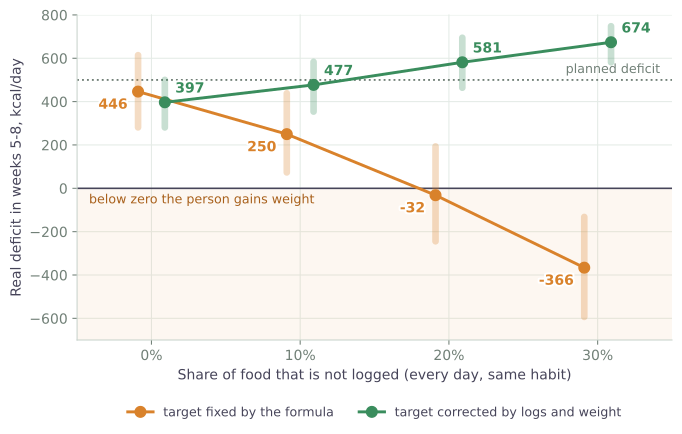
| Food not logged | Real deficit, formula target | Real deficit, corrected target | Weight lost in 8 weeks, formula / corrected |
|---|---|---|---|
| 0% | 446 (281–614) | 397 (281–500) | 2.8 kg / 2.2 kg |
| 10% | 250 (73–438) | 477 (354–583) | 1.5 kg / 1.9 kg |
| 20% | −32 (−244–193) | 581 (464–695) | −0.2 kg / 1.5 kg |
| 30% | −366 (−593–−132) | 674 (581–748) | −2.3 kg / 1.0 kg |
With a target fixed by the formula, under-logging 20% of food leaves the person with a real deficit of about zero: they eat what the log calls “2,100” and do not lose weight. This is the same pattern as in the diet-resistant patients above [6], and it matches what many people report when they are told they must be eating more than they say. The corrected target keeps the real deficit near the plan because it is expressed in the same units as the log, and the reason is arithmetic. Before any weight has changed, the corrected estimate of expenditure is the logged intake of a person at maintenance, . The target is then , so what the person really eats is , and the real deficit is
For , and this gives 625 for the corrected target and −25 for the formula target, which are the starting values of the simulation. As the weight trend catches up, the corrected deficit relaxes from towards , which is why Figure 1 shows 581 at 20%, below the starting 625. In short, a steady habit, too low or too high, is absorbed as long as it stays steady. A bias that changes from week to week cannot be absorbed this way, and that is the realistic case.
Results
| Question | Formula | Logs and weight |
|---|---|---|
| Typical error of expenditure, simulated, weeks 6–8 | 160–170 kcal/day | 110–120 kcal/day |
| Typical error in weeks 2–4 of a new diet | about 170 kcal/day | 220–300 kcal/day without a water estimate in the harshest case; 190–215 with it; 110–150 with it for a typical plan |
| Real deficit when 20% of food is not logged, plan 500 kcal/day | about 0 (−32) | 581 |
| Error from using 7,700 kcal/kg where the body behaves like 9,100 | none | about 80–100 kcal/day at 0.5 kg/week of loss |
| Share within 100 kcal of the truth at week 8 | 31% | 42% |
How we use this in MuscleTiger
The adaptive calorie goal is part of MuscleTiger Premium. It follows the loop in section 4: a formula start, a Kalman-filtered weight trend, recent logged intake and equation (3). It needs a few weeks of regular weigh-ins and reasonably complete food logs before it changes anything, it recalculates every few days, and it holds your calories steady when you are training and your weight is flat.
Writing this note, we found a weakness that the simulation made visible: the first version had no special handling of the early water drop, so for someone starting a diet the estimate in weeks 2 to 4 could come out too high and the target could drift upwards for a while. We have since added the water estimate described in section 3. It removes most of the problem in our simulation, but not all of it in the harshest case, so treat the adaptive number in the first month of a new diet as provisional and judge progress by the trend over four to six weeks.
Conclusions
- The formula is a start, and your own data can improve it. Intake minus the change in weight measures expenditure without a laboratory, and a weight-only model has matched the reference method on average to within 40 kcal/day [11]. It needs weeks of data.
- Do not read the first month of a diet as metabolism. Early loss includes water that carries no energy, and an estimate that treats it as fat will think you burn more than you do. Without a water estimate our simulated version was worse than the formula in weeks 2 to 4 in the harshest case; with it, the gap shrinks a lot and for a typical plan disappears.
- After about six weeks the corrected estimate is better. In the simulation, a typical error of 110–120 kcal/day against 160–170 for the formula, and 42–47% of people within 100 kcal of the truth against about 31%.
- Stay consistent; perfect logging is not required. A steady habit of logging too little is absorbed by a target corrected from your own data, while a fixed formula target turns it into a deficit of zero. Log the same way every day and weigh yourself most days under similar conditions.
- Every estimate is a range. A realistic error is 100 to 200 kcal/day for any practical method, and our simulation assumes a steady person who weighs often and logs regularly. Real life is noisier.
Limits of this note. Everything in section 5 is a simulation with parameters chosen by us. It has not been tested against doubly labelled water or other measured expenditure in real users, and the water drop, the 15% daily intake variation and the 10% error in the formula are assumptions. The size of the water effect is fitted to three controlled studies of a few days to a few weeks and may differ in people who change their food only slightly or who start to train at the same time. The simulated person follows a published average model of weight [4] and does not represent any individual. We did not simulate every rule of the app: the safety floor, the recomposition guard and the exercise term are left out. This is general information and does not replace medical advice.
Sources
- Mifflin MD, St Jeor ST, Hill LA, et al. A new predictive equation for resting energy expenditure in healthy individuals. Am J Clin Nutr 1990;51:241–7. doi:10.1093/ajcn/51.2.241
- Frankenfield D, Roth-Yousey L, Compher C. Comparison of predictive equations for resting metabolic rate in healthy nonobese and obese adults: a systematic review. J Am Diet Assoc 2005;105:775–89. doi:10.1016/j.jada.2005.02.005
- Hall KD, Sacks G, Chandramohan D, et al. Quantification of the effect of energy imbalance on bodyweight. Lancet 2011;378:826–37. doi:10.1016/S0140-6736(11)60812-X
- Chow CC, Hall KD. Short and long-term energy intake patterns and their implications for human body weight regulation. Physiol Behav 2014. doi:10.1016/j.physbeh.2014.02.044
- Leibel RL, Rosenbaum M, Hirsch J. Changes in energy expenditure resulting from altered body weight. N Engl J Med 1995;332:621–8. doi:10.1056/nejm199503093321001
- Lichtman SW, Pisarska K, Berman ER, et al. Discrepancy between self-reported and actual caloric intake and exercise in obese subjects. N Engl J Med 1992;327:1893–8. doi:10.1056/nejm199212313272701
- Chao AM, Quigley KM, Wadden TA. Dietary interventions for obesity: clinical and mechanistic findings. J Clin Invest 2021;131(1):e140065. doi:10.1172/JCI140065
- Waterworth SP, Kerr CJ, McManus CJ, et al. Obese individuals do not underreport dietary intake to a greater extent than nonobese individuals when data are allometrically scaled. Am J Hum Biol 2022;34(7):e23743. doi:10.1002/ajhb.23743
- Breit MJ, Pan Z, Ostendorf DM, et al. Using time-weighted averages of total daily energy expenditure to estimate energy intake during a weight loss intervention. Obesity 2025;33:2093–102. doi:10.1002/oby.70008
- Roberts BM, Helms ER, Trexler ET, Fitschen PJ. Nutritional recommendations for physique athletes. J Hum Kinet 2020;71:79–108. free full text (PMC) · doi:10.2478/hukin-2019-0096
- Sanghvi A, Redman LM, Martin CK, Ravussin E, Hall KD. Validation of an inexpensive and accurate mathematical method to measure long-term changes in free-living energy intake. Am J Clin Nutr 2015;102:353–8. doi:10.3945/ajcn.115.111070
- Hall KD, Chow CC. Estimating changes in free-living energy intake and its confidence interval. Am J Clin Nutr 2011;94:66–74. doi:10.3945/ajcn.111.014399
- Hall KD, Bemis T, Brychta R, et al. Calorie for calorie, dietary fat restriction results in more body fat loss than carbohydrate restriction in people with obesity. Cell Metab 2015;22:427–36. doi:10.1016/j.cmet.2015.07.021
- Hall KD, Chen KY, Guo J, et al. Energy expenditure and body composition changes after an isocaloric ketogenic diet in overweight and obese men. Am J Clin Nutr 2016;104:324–33. doi:10.3945/ajcn.116.133561
- Yang MU, Van Itallie TB. Composition of weight lost during short-term weight reduction. Metabolic responses of obese subjects to starvation and low-calorie ketogenic and nonketogenic diets. J Clin Invest 1976;58:722–30. doi:10.1172/JCI108519