

MuscleTiger research notes · No. 1
Forecasting weight loss honestly: why the 3,500-calorie rule fails and why your scale lies
Many people know the 3,500-calorie rule: cut 500 kcal a day and you lose about 0.45 kg (1 lb) a week. It is also not true, at least not for longer than a few weeks.
TL;DR
The 3,500 kcal rule holds for a few weeks, not for a year. As you lose weight you burn less, so over a year you lose roughly half of what the straight line promises, and part of the early drop is water. Judge progress by the three-to-four-week trend and treat any forecast as a range, not a date.
There are three plain reasons. As you lose weight your body burns less, so the same cut becomes a smaller deficit and the loss slows down. Part of what disappears in the first weeks is water, not fat. And the scale jumps around for reasons that have nothing to do with fat, so it is hard to tell what is really happening.
The rule itself comes from one number: a kilogram of body weight is "worth" about 7,700 kcal (3,500 kcal per pound). Multiply your daily deficit by the number of days and divide by 7,700, and you know how much you will lose by a given date. The arithmetic is simple, which is why it stuck.
In this note we look at where the rule comes from and what it silently assumes, what controlled studies and a dynamic model say instead, how large and what kind the scale noise is, and how precise a forecast can honestly be. At the end we show how we use this in the MuscleTiger forecast and where it still falls short. The numbers come from published studies, listed at the bottom; where we calculate something ourselves, we say so. Weights are in kilograms with pounds in brackets.
1. Where the 3,500 kcal rule comes from
The rule treats a kilogram of lost weight as a fixed amount of stored energy. The figure is a mixture. Fat mass holds about 9,400 kcal per kilogram (4,300 per lb), while fat-free mass holds only about 1,800 kcal per kilogram (820 per lb) [2]. A blend of roughly 78% fat and 22% other tissue gives about 7,700 kcal/kg (3,500 kcal/lb), which is where the familiar number comes from (our arithmetic from those two figures). With a daily deficit (kcal/day) sustained for days, the rule predicts
so 500 kcal/day for a week is about 0.45 kg (1 lb), and the same line continues for as long as you like.
Equation (1) hides two assumptions. First, that the tissue you lose always has the same composition. Second, and more important, that the gap between what you eat and what you burn stays constant while you lose weight. Hall and Chow [1] note that the rule is a reasonable approximation for modest, short-term changes in people with overweight or obesity, overestimates in others, and that its most serious flaw is ignoring how the body changes as weight falls.
2. What happens instead: the body adjusts
A smaller body is cheaper to keep running, so energy expenditure falls as you lose weight. The simplest way to capture this is a linear model of energy balance. For an average sedentary adult, Chow and Hall [3] write
where is body weight (kg), is energy intake (kcal/day), kcal/kg (4,100 kcal/lb) is the effective energy density of a change in body weight, kcal/kg/day (10 kcal/lb/day) is how much expenditure rises per kilogram of body weight, and kcal/day is the part of expenditure that does not depend on weight. For a constant intake the solution is an exponential approach to a new equilibrium:
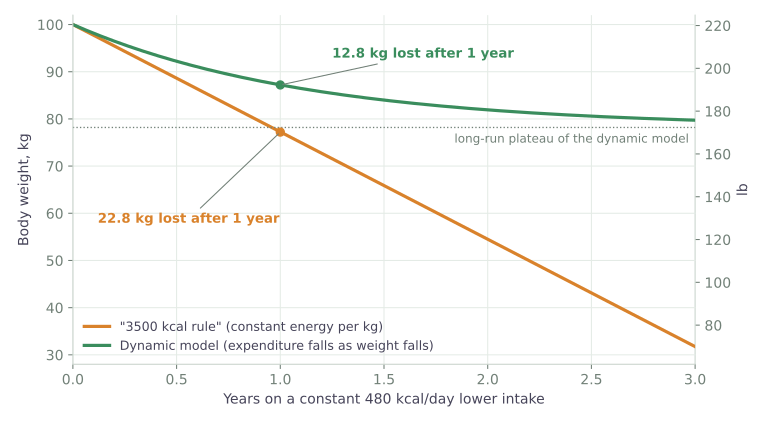
The time constant of about 410 days means that the half-way point is reached in roughly nine to twelve months and the change is essentially complete only after about three years. Hall and colleagues [2] describe the same behaviour: half-times of about a year, and a rule of thumb that every sustained change of about 24 kcal/day in intake ends up as roughly one kilogram (2.2 lb) of body weight. The same model is implemented in the NIDDK Body Weight Planner [9].
What Figure 1 shows. Both lines start from the same cut in calories. The straight line is what the 3,500 rule predicts: the same loss every week, with no end. The curve is what happens when the body adapts. A lighter body burns fewer calories, so the same intake leaves a smaller and smaller gap, and the loss slows down and flattens out.
Does reality agree?
Thomas and colleagues [4] collected seven studies in which weight loss was supervised or objectively measured, so adherence was known: 103 adults, 31 to 93 days, an average planned deficit of about 1,439 kcal/day. The 3,500 kcal rule predicted an average loss of 12.5 kg (27.6 lb). The actual loss was 9.1 kg (20.1 lb), a ratio of 0.73. For five of the studies the dynamic model of Hall et al. predicted 8.3 kg (18.4 lb) against 7.7 kg (17.0 lb) actual: close, and still slightly optimistic by about 8%.
Outside the lab there is an additional effect. Real programmes often show a weight plateau after six to eight months. Both Hall et al. [2] and Chow and Hall [3] attribute much of it to declining adherence rather than to metabolic slowdown alone. The practical consequence is that the gap between measured and predicted weight is informative: it can be used to estimate how closely a person is following the plan.
3. The scale is not a fat meter
What moves the number
- Day to day. Chow and Hall [3] point out that even large random deviations in daily intake, of the order of 600 kcal/day, would change body weight by only about a kilogram (2 lb). Day-to-day swings of a kilogram or so (2 lb) therefore come mostly from water, gut contents and glycogen, not from fat.
- Across the week. In 1,421 people taking part in a European weight-loss maintenance trial, Turicchi et al. [5] found within-week fluctuations of about 0.35%, with weight higher at the weekend and lower on weekdays, and a mean increase of 1.35% over Christmas. This group was maintaining weight after loss, so the exact figures may differ for people actively dieting.
- At the start of a diet. A 70 kg (154 lb) man stores about 500 g of glycogen (roughly 100 g in the liver and 400 g in muscle), and each gram is bound to three to four grams of water. Cutting carbohydrate or calories can therefore remove one to two kilograms (2 to 4 lb) within days without any fat loss, and starting creatine adds another one to two kilograms of water [6].
A simple model of the measurement
On any day, the number on the scale is the sum of four things. In symbols:
- is the reading on the scale on day , the only thing we can observe.
- is the weight of the body's tissue (fat and lean mass). It changes slowly and is the thing we actually want to follow.
- is the part due to glycogen and the water bound to it (and to creatine, if you take it). It is largest in the first weeks of a diet and then settles.
- is the weekly rhythm: a few hundred grams higher around the weekend, lower on weekdays.
- is everything else that is random from day to day: how much you drank, when you last ate, time of day.
The job of a trend estimate is to recover from the readings . The simplest tool is an exponentially weighted moving average,
where is the trend estimate on day (what the app shows as your weight) and is how much trust we give to today's reading. Each day the trend moves a fraction of the way from yesterday's trend towards today's reading. With a small , say 0.1, the trend is smooth but slow to react; with a large it follows every jump of the scale.
Another way to see why this works: an exponential moving average is a low-pass filter, the same idea used in electronics and signal processing. Fast, random changes such as the daily noise are largely averaged out, while the slow change we care about, the real trend , passes through almost unchanged. The weekly rhythm sits in between, so a smaller suppresses it more. The price is a delay: the filter notices a genuine change a few days late. It also explains a limit we come back to below: the early glycogen and water drop is a slow change too, so the filter lets it through together with the fat loss.
The table below puts the sizes next to each other.
| What moves the scale | How much | How fast |
|---|---|---|
| Water, gut contents, glycogen (day to day) | a kilogram or so (2 lb); not caused by fat [3] | hours to days |
| Weekly rhythm | about 0.35% of body mass, around 0.3 kg (0.7 lb) at 90 kg (198 lb) [5] | weekend up, weekdays down |
| Start of a diet: glycogen and its water | 1–2 kg (2–4 lb) [6] | first one to two weeks |
| Starting creatine | 1–2 kg (2–4 lb) of water [6] | first weeks |
| Holidays | +1.35% on average over Christmas [5] | a few weeks |
| Fat loss at 0.5–1% of body mass per week | 0.45–0.9 kg (1–2 lb) per week at 90 kg | steady |
A simple example shows why this matters for a forecast. Take someone who really loses 0.4 kg (0.9 lb) of fat a week and, in the first two weeks, also loses 1.5 kg (3.3 lb) of glycogen and water. The scale falls by 0.8 + 1.5 = 2.3 kg (5 lb) in 14 days. Read naively, that is 1.15 kg (2.5 lb) a week, almost three times the real pace. Smoothing the readings removes the daily jitter, but it cannot tell water from fat. Only time can: after about a month the early drop is behind you and the trend shows the real rate.
Does the choice of smoother matter?
Turicchi et al. [7] compared Kalman filtering, exponential smoothing and linear interpolation on smart-scale data from 50 adults who had previously lost weight, and found similar errors (about 0.62 to 0.64% of body weight) for all of them. A sensible method, applied with care for missing days and implausible readings, matters more than which method it is.
4. How precise can a forecast be?
A forecast needs a starting point: how many calories you burn each day. Calculators estimate it from height, weight, age and activity, and the estimate is usually close. Hall and colleagues [2] say that even a good estimate is typically off by about 5% of the true value, sometimes more, unless expenditure is measured with doubly labelled water, a laboratory method that tracks the body's real energy use. For someone who really burns 2,500 kcal a day, 5% is about 125 kcal, roughly a slice or two of bread. Even the laboratory measurement is not exact: Breit et al. [8] found that repeating it on the same person gives results that vary by about 150 kcal/day, and that two ways of determining the same person's energy use can differ by 121 to 275 kcal/day.
So the uncertainty is small in daily terms. It matters for a forecast only because a small gap, kept up for months, adds up. Equation (3) shows by how much. In the long run the weight you settle at shifts by
for every 100 kcal/day of difference between the assumed and the real expenditure.
A concrete case: three people follow exactly the same plan, a 500 kcal/day deficit from 90 kg (198 lb). The only difference is how many calories they really burn compared with what the calculator assumed: 150 more, exactly as assumed, or 150 fewer, which is about a slice and a half of bread a day. By equation (3) their weights after one year are 72.7 kg (160 lb), 76.7 kg (169 lb) and 80.7 kg (178 lb). Nobody did anything differently, and the calculator was not wrong in any way that matters day to day; a crumb-sized gap simply accumulates.
The good news is that this gap is not hidden. It shows up in your own weigh-ins, and the difference between measured and predicted weight carries information about both adherence and the error in the starting estimate. Chow and Hall [3] propose using exactly that loop to update the forecast over time. This is also why a range works better than a single date: it says honestly where most people end up, and the forecast can narrow as your own data comes in. One caveat is that self-reported food intake is notoriously inaccurate, so any estimate that relies on logs inherits that error.
Results
| Question | Simple rule | What the evidence says |
|---|---|---|
| One year at a 480 kcal/day lower intake, starting at 100 kg (220 lb) | 22.8 kg (50 lb) lost, and still falling | 12.8 kg (28 lb) lost in the published linear model, levelling off near 22 kg (48 lb) after about three years |
| Supervised studies, 31–93 days, planned deficit about 1,439 kcal/day | 12.5 kg (27.6 lb) predicted | 9.1 kg (20.1 lb) actual (ratio 0.73); the dynamic model predicted 8.3 kg (18.4 lb) against 7.7 kg (17.0 lb) [4] |
| First two weeks of a diet | all of it is fat | one to two kilograms (2–4 lb) can be glycogen and water [6], so the rate read from these weeks can be about three times too high |
| Normal weekly fluctuation | none | about 0.35% of body mass, around 0.3 kg (0.7 lb) at 90 kg (198 lb) [5] |
| Uncertainty from the expenditure estimate | none | a small gap of 150 kcal/day (about a slice and a half of bread) moves the one-year result by about 4 kg (9 lb) each way in the 90 kg example |
How we use this in MuscleTiger
The forecast you see after onboarding is built on this dynamic model, with the same equation and the same constants as Chow and Hall: 9,100 kcal/kg and 22 kcal/kg/day. It assumes that you keep eating at your planned calorie level, and it lets your expenditure fall with your weight week by week. The loss therefore starts at the planned pace, slows down and eases into a plateau, the shape of equation (3) rather than a straight line. The starting point, your planned calories, is personal. We size the calorie deficit with the same 9,100 kcal/kg, so the pace you are aiming for and the pace in the forecast agree. The chart shows three lines, a slower, an on-plan and a faster scenario, and the slower one is a margin for imperfect adherence rather than a measured constant.
The weight you see in the app is a smoothed trend with outlier handling rather than the raw daily number. The adaptive calorie goal corrects the formula-based estimate with your own logged intake and weight trend.
Conclusions
- Use the 3,500 kcal rule only for short horizons. Over a year, expect roughly half of what the straight line promises for a constant intake, and expect the loss to slow down.
- Judge progress by the trend over three to four weeks, not by one day or the first two weeks. Early drops are largely water and glycogen and should not set your expectations.
- Expect a range, not a date. A slice of bread a day, the size of a normal estimation error, adds up to a few kilograms over a year. That is why a forecast should be a range and should learn from your own weigh-ins.
- Adherence is the largest lever you control. Comparing measured and predicted weight is a way to notice drift before the plateau.
Limits of this note. The dynamic model is a published average for sedentary adults, not a model of any individual. Figure 1 and the worked examples are computed from it. Individual body composition, activity and measurement habits will change the numbers. This is general information, not medical advice.
Sources
- Hall KD, Chow CC. Why is the 3500 kcal per pound weight loss rule wrong? Int J Obes 2013;37:1614. doi:10.1038/ijo.2013.112
- Hall KD, Sacks G, Chandramohan D, et al. Quantification of the effect of energy imbalance on bodyweight. Lancet 2011;378:826–37. doi:10.1016/S0140-6736(11)60812-X
- Chow CC, Hall KD. Short and long-term energy intake patterns and their implications for human body weight regulation. Physiol Behav 2014. doi:10.1016/j.physbeh.2014.02.044
- Thomas DM, Martin CK, Lettieri S, et al. Can a weight loss of one pound a week be achieved with a 3500-kcal deficit? Commentary on a commonly accepted rule. Int J Obes 2013;37:1611–3. doi:10.1038/ijo.2013.51
- Turicchi J, O’Driscoll R, et al. Weekly, seasonal and holiday body weight fluctuation patterns among individuals engaged in a European multi-centre behavioural weight loss maintenance intervention. PLoS ONE 2020. doi:10.1371/journal.pone.0232152
- Roberts BM, Helms ER, Trexler ET, Fitschen PJ. Nutritional recommendations for physique athletes. J Hum Kinet 2020;71:79–108. free full text (PMC) · doi:10.2478/hukin-2019-0096
- Turicchi J, O’Driscoll R, Finlayson G, et al. Data imputation and body weight variability calculation using linear and nonlinear methods in data collected from digital smart scales: simulation and validation study. JMIR Mhealth Uhealth 2020;8(9):e17977. doi:10.2196/17977
- Breit MJ, Pan Z, et al. Using time-weighted averages of total daily energy expenditure to estimate energy intake during a weight loss intervention. Obesity 2025;33:2093–102. doi:10.1002/oby.70008
- NIDDK Body Weight Planner (an implementation of the model of Hall et al.). niddk.nih.gov